6.1. Using matplotlib styles
 This is one of the 100+ free recipes of the IPython Cookbook, Second Edition, by Cyrille Rossant, a guide to numerical computing and data science in the Jupyter Notebook. The ebook and printed book are available for purchase at Packt Publishing.
▶ Text on GitHub with a CC-BY-NC-ND license
▶ Code on GitHub with a MIT license
▶ Go to Chapter 6 : Data Visualization
▶ Get the Jupyter notebook
Recent versions of matplotlib have significantly improved the default style of the figures. Today, matplotlib comes with a set of high-quality predefined styles along with a styling system that lets one customize all aspects of these styles.
How to do it...
1. Let's import the libraries:
import numpy as np
import matplotlib as mpl
import matplotlib.pyplot as plt
%matplotlib inline
2. Let's see the list of all available styles:
sorted(mpl.style.available)
['bmh',
 'classic',
 'dark_background',
 'fivethirtyeight',
 'ggplot',
 'grayscale',
 'mycustomstyle',
 'seaborn',
 ...
 'seaborn-whitegrid']
3. We create a plot:
def doplot():
    fig, ax = plt.subplots(1, 1, figsize=(5, 5))
    t = np.linspace(-2 * np.pi, 2 * np.pi, 1000)
    x = np.linspace(0, 14, 100)
    for i in range(1, 7):
        ax.plot(x, np.sin(x + i * .5) * (7 - i))
    return ax
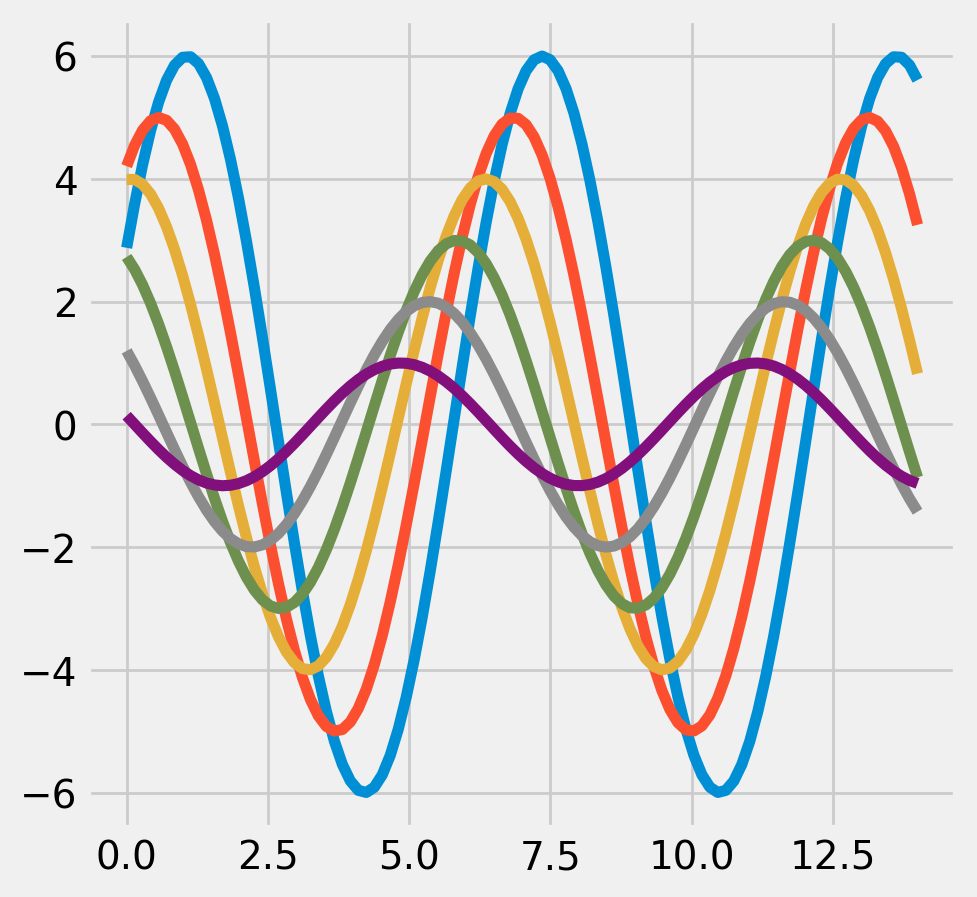
3. We can set a style with mpl.style.use(). All subsequent plots will use this style:
mpl.style.use('fivethirtyeight')
doplot()
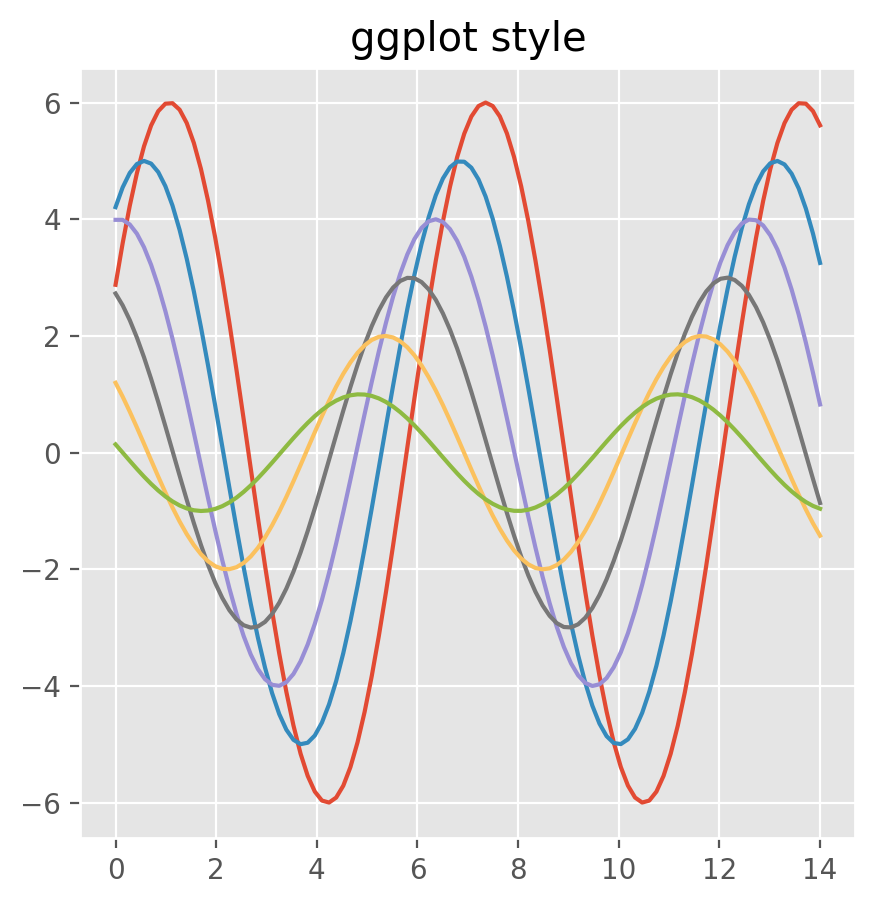
4. We can temporarily change the style for a given plot using the with context manager syntax:
# Set the default style.
mpl.style.use('default')
# Temporarily switch to the ggplot style.
with mpl.style.context('ggplot'):
ax = doplot()
ax.set_title('ggplot style')
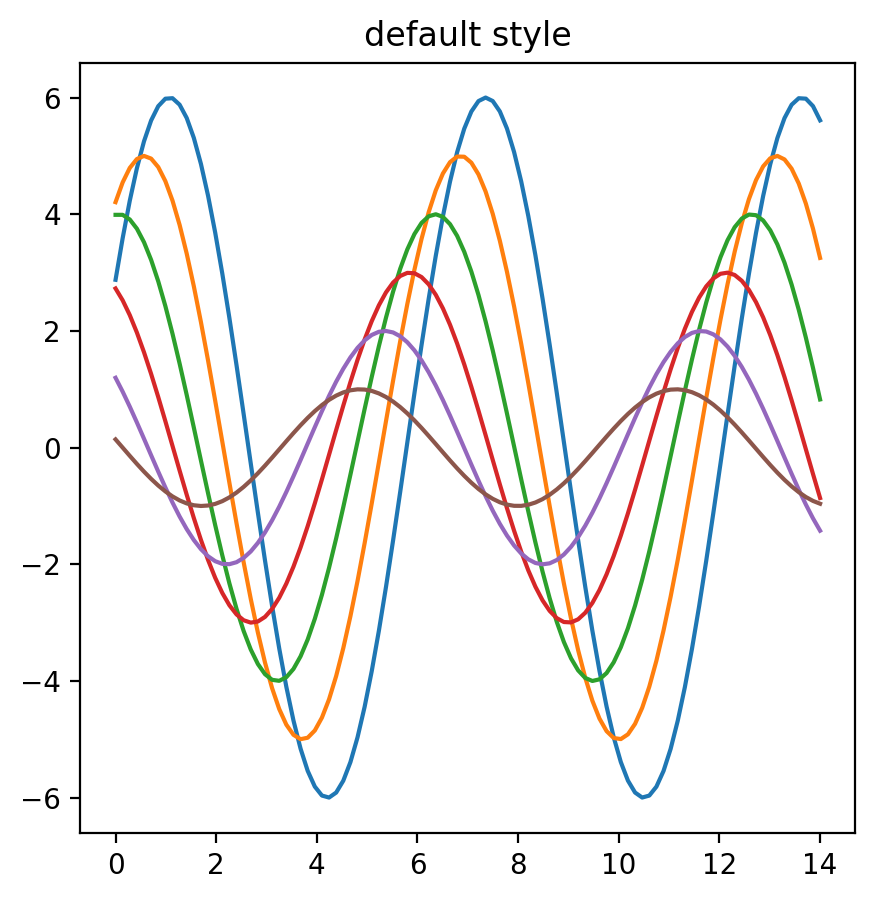
# Back to the default style.
ax = doplot()
ax.set_title('default style')
5. Now, we will customize the ggplot style by creating a new custom style to be applied in addition to ggplot. First, we specify the path to the custom style file, which should be in mpl_configdir/stylelib/mycustomstyle.mpltstyle, where mpl_configdir is the matplotlib config directory. Let's get this config directory:
cfgdir = matplotlib.get_configdir()
cfgdir
'/home/cyrille/.config/matplotlib'
6. We get the path to the file using the pathlib module:
from pathlib import Path
p = Path(cfgdir)
stylelib = (p / 'stylelib')
stylelib.mkdir(exist_ok=True)
path = stylelib / 'mycustomstyle.mplstyle'
7. In this file, we specify the option of a few parameters:
path.write_text('''
axes.facecolor : f0f0f0
font.family : serif
lines.linewidth : 5
xtick.labelsize : 24
ytick.labelsize : 24
''')
8. We need to reload the library after we add or change a style:
mpl.style.reload_library()
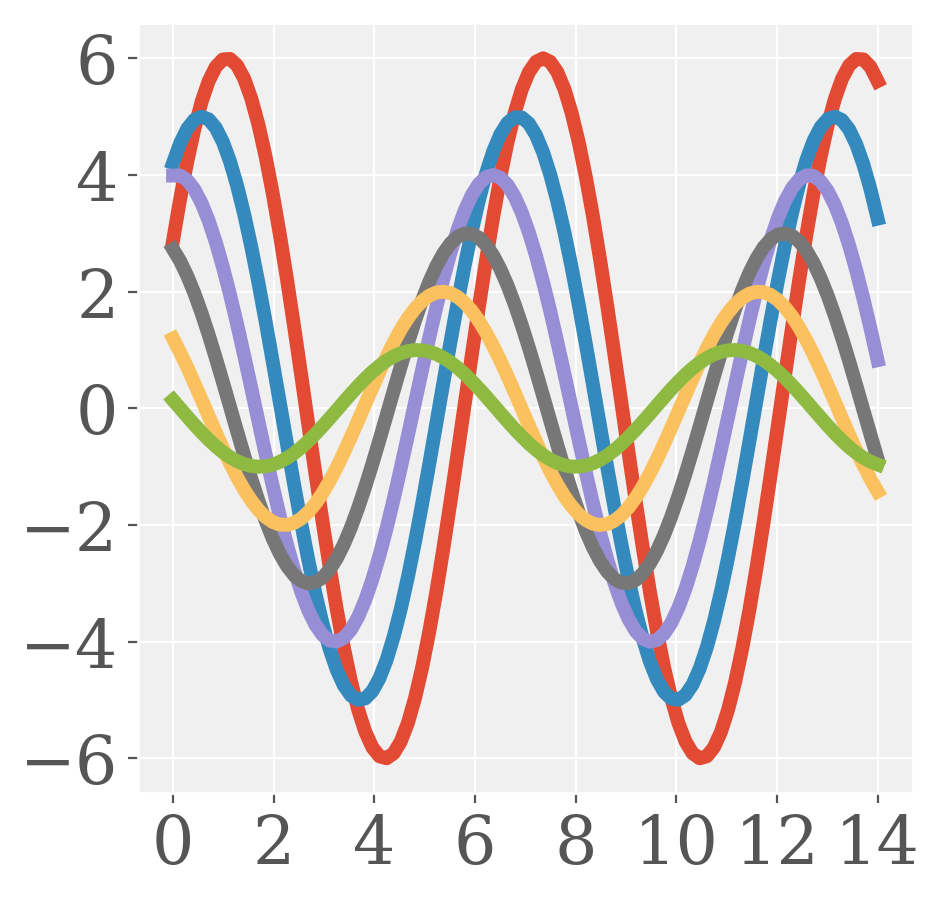
9. Here is the result of the new style (we first apply the ggplot style, then we customize it by applying the options of our new style):
with mpl.style.context(['ggplot', 'mycustomstyle']):
    doplot()
There's more...
Here are a few references:
- Customizing matplotlib, at http://matplotlib.org/users/customizing.html
- Matplotlib style gallery https://tonysyu.github.io/raw_content/matplotlib-style-gallery/gallery.html
- Matplotlib: beautiful plots with style, at http://www.futurile.net/2016/02/27/matplotlib-beautiful-plots-with-style/
See also
- Creating statistical plots easily with seaborn